
CSV Graph
Create line, bar, and scatter charts from CSV files in your browser.
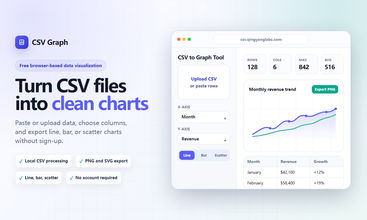
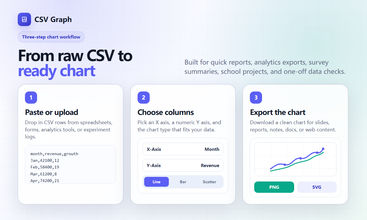
CSV Graph is a free browser-based CSV chart maker for quick data visualization. Paste CSV text or upload a CSV file, choose X and Y columns, then create line, bar, or scatter charts in seconds.
It is useful for analysts, students, marketers, founders, and developers who need a clean chart from a CSV export without opening a spreadsheet or setting up a dashboard.
Your data stays local in your browser. No sign-up is required, and charts can be exported as PNG or SVG for reports, slides, docs, and websites.

Makers


Maker of free browser-based data visualization and productivity tools.
Share your take on this product
Comment
Write at least
20
characters. Specific feedback improves community quality.
No comments match your search.
Write at least
20
characters. Specific feedback improves community quality.
Trending Products
View all









No reviews match your search.
Maker of free browser-based data visualization and productivity tools.
No active deals right now.
Free
Outrank
 🥇
aelívra
A personalised wellbeing platform that combines health records, symptoms, wearables, and evidence-based protocols for sleep, energy, nutrition, stress, and recovery.
🥇
aelívra
A personalised wellbeing platform that combines health records, symptoms, wearables, and evidence-based protocols for sleep, energy, nutrition, stress, and recovery.
 🥈
The Board
A public leaderboard where brands buy ranked spots, show a logo and link, and compete for attention through bids and takeovers.
🥈
The Board
A public leaderboard where brands buy ranked spots, show a logo and link, and compete for attention through bids and takeovers.
 🥉
ScholarSail
AI study tools for students that turn notes into mind maps, spaced-repetition flashcards, and 3D memory palaces while organizing focused work.
🥉
ScholarSail
AI study tools for students that turn notes into mind maps, spaced-repetition flashcards, and 3D memory palaces while organizing focused work.
🚀 Want this spot?
Pay what you want










 Continue with Google