CourseGraph
Udemy Course Analytics for Trainers


Course Graph is a Course Analytics tool for Trainers. You can track the daily sales for any course in robust historical charts. Find out the average revenue earned by each course Search over 155,000 Udemy courses based on topic, keyword & category.
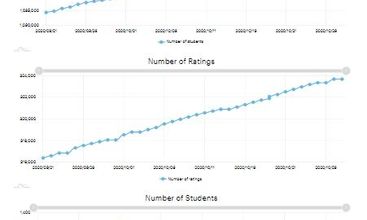
With the help of CourseGraph, you can track the most insightful stats of any Udemy course
- Number of students/day
- Number of students increased/day
- Number of ratings/day
- Number of ratings increased/day
- Estimated revenue/day
Share your take on this product
Comment
Write at least
50
characters. Specific feedback improves community quality.
No comments match your search.
Write at least
50
characters. Specific feedback improves community quality.
Trending Products
View allNo reviews match your search.
No team details yet.
No active deals right now.